F1
The plan cannot see the road
No sensing, no feedback. The controller runs the same schedule into an empty street and a saturated one.
Pitch deck
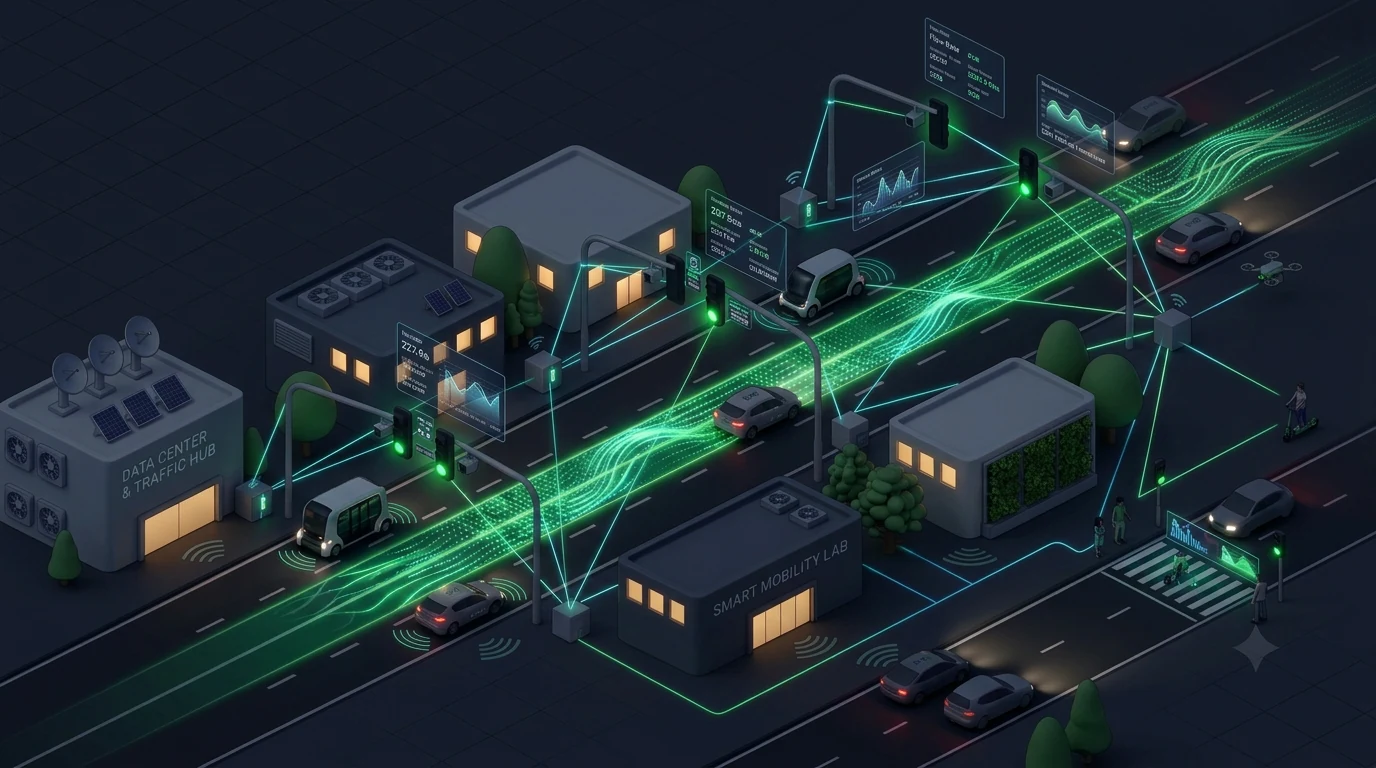
A deep reinforcement learning controller that replaces fixed-timer signal plans, reading each junction in real time and choosing its next phase every 5 seconds.
Median wait reduction
86%
vs. fixed-time control, across 8 scenarios
Scenarios improved
8 / 8
and at every random seed, not only on average
Status
Simulation-validated · Pre-pilot
No field deployment yet. All results are from simulation.
Founder
Osborn Dogbe
Valiborn Technologies · Accra, Ghana
02 · The problem
That figure is hours out of people's days, fuel burnt while standing still, and work that never gets done, piling up on the same Accra corridors every weekday morning and evening.
Annual cost breakdown
Source: “The Cost of Gridlock: A Policy Brief on Ghana’s Urban Traffic Crisis,” Glima Research, February 2026.
03 · Why fixed timers fail
No sensing, no feedback. The controller runs the same schedule into an empty street and a saturated one.
A market-day surge or an incident produces demand the fixed plan has no mechanism to absorb.
Morning flow is inbound, evening outbound. One split cannot serve both, so one peak is always mistimed.
Traffic cleared at one light simply queues again at the next 300 m down the corridor.
04 · The solution
ATCS-GH is a software controller. It keeps the existing poles, heads and phase order, and substitutes the one component that is failing: the decision about which phase runs next, and for how long.
Runs end-to-end on a laptop. No proprietary controller cabinet, no vendor lock.
Three independent agents, one per junction, with no explicit communication, each sees its neighbours through its own state vector.
Private cars, shared trotros and signal-respecting pedestrian crossings, modelled on real Accra geometry, not a generic grid.
Test bed, N6 Nsawam corridor
Three signalised junctions 300 m apart, Achimota/Neoplan, Asylum Down, Nima/Tesano, plus a single-junction bed at 5.6216°N 0.2193°W. Three independent agents, no explicit communication. Both beds are calibrated from real Accra geometry in SUMO, the microsimulator used by transport agencies.
05 · How it works
41 at a single junction; 46 per junction on the corridor.
PyTorch. One agent per junction, the corridor runs three, trained independently.
One of five protected-left phases is committed to the signal, then the loop closes.
Loop closes, 720 decisions per hour, per junction
06 · Action space & safety
Keep the current phase running, extend a green that is still clearing queue.
North–south straight movements.
North–south protected left turns, no conflicting through movement.
East–west straight movements.
East–west protected left turns, no conflicting through movement.
Deliberate exclusion
Permissive and all-green phases are removed from the action space. They deadlock the junction box: opposing streams enter the intersection together, block each other mid-turn, and no subsequent phase can clear them. This was not a design assumption. It was a real failure observed in training, diagnosed, and fixed by constraining the action space. A hard-coded emergency-vehicle preemption rule was also removed, so every result here is purely learned behaviour with no scripted override propping it up.
07 · Training methodology
Plenty of people have put deep RL on traffic. These numbers hold up because of what happens during training: rewards kept from blowing up under saturation, exploration that is worth something early, no overfitting to one scenario, and a checkpoint chosen on average performance rather than its best run.
Saturated traffic cannot produce a runaway reward signal. Without the bound, a gridlocked junction generates penalties large enough to trap the agent in the gridlock that caused them.
70% of exploratory actions follow a sustained-green heuristic. Heavy scenarios keep flowing while exploration decays, so the agent learns from traffic that moves instead of from a car park.
One demand scenario per episode, round-robin. The agent never gets to specialise in the easy case, every scenario keeps returning until it is handled.
The shipped checkpoint is the one whose worst scenario, or worst junction, on the corridor, performs best. Not its best case. Gated to near-greedy exploration, so selection reflects deployment behaviour.
08 · Results
Every number here comes from a greedy policy with exploration switched off, run over full two-hour scenarios, five random seeds each. Nothing is a training-time best case.
8 / 8
Scenarios improved
No scenario where the learned controller is worse.
40
Evaluation runs
8 scenarios × 5 seeds, greedy policy, ε = 0.
7200 s
Per run
Full two-hour demand profiles, not short episodes.
≈ 2 h
To train the corridor
Three agents, on a laptop. No cluster required.
| System | Scenario | ATCS-GH | Fixed timer | Reduction |
|---|---|---|---|---|
| Corridor | Evening rush | 10.5 s | 134.8 s | 92% |
| Corridor | Morning rush | 13.0 s | 143.1 s | 91% |
| Corridor | Off-peak | 3.4 s | 25.6 s | 87% |
| Single | Weekend market✳ | 13.8 s | 885.8 s | 98% |
| Single | Morning rush | 27.8 s | 186.7 s | 85% |
| Single | Continuous day | 18.1 s | 47.6 s | 62% |
| Single | Off-peak | 8.4 s | 14.2 s | 41% |
| Single | Evening rush | 256.1 s | 427.4 s | 40% |
Mean average vehicle waiting time, seconds, lower is better. Greedy policy, ε = 0, 7200 s runs, 5 seeds each. Baseline is a realistic protected-left fixed timer: NS 40 s through / 15 s left, EW 25 s / 10 s. ✳ collapse-avoidance, not typical performance, see section 09.
09 · How to read these numbers
A reviewer's first instinct on seeing a 98% improvement should be suspicion. So here is the reading we would give ourselves, unprompted. The honest headline is 85–92% on peak-hour scenarios, and every qualifier below is load-bearing.
98% is collapse-avoidance, not typical performance.
In the weekend-market scenario the fixed-timer baseline is a gridlocked junction, so the agent is preventing a breakdown rather than improving a plan that works. Read it as robustness, not speed-up. The honest headline is 85–92% on peak-hour scenarios.
The comparison is always against fixed-time control.
That is the status quo across much of Accra, which is why it is the right baseline. Against a modern vehicle-actuated system the margin would be smaller, we have not measured that comparison and do not claim it.
These are simulation results. There is no field deployment.
Status is simulation-validated, pre-pilot. Everything reported here comes from SUMO with calibrated Accra geometry. No vehicle in Accra has yet been stopped or released by this controller.
The agent currently reads idealised sensor data.
Real cameras and inductive loops give noisy, dropout-prone readings. Field performance is expected to be lower than these figures, and quantifying that gap is the next phase of work, not an afterthought.
Demand was calibrated to solvable levels.
Both controllers are graded against an achievable target rather than an impossible one. Loading the network past the point where any signal plan can cope would inflate the relative improvement without saying anything useful.
10 · Validation rigour
A realistic protected-left fixed timer. NS 40/15 s, EW 25/10 s. An earlier, easier baseline was discarded for being too easy to beat.
Maximin checkpointing: we ship the model with the best worst case, so the reported numbers are not a lucky snapshot cherry-picked from a training curve.
Exploration off (ε = 0), full 7200 s scenarios, 5 seeds each, 40 runs total. Evaluated the way it would run on the street, not the way it trains.
Fixed seeds, a scripted evaluation harness, and the whole pipeline runs on a laptop, so any reviewer can re-run it rather than take our word for it.
11 · What's built
Five components exist and run today, end to end, on commodity hardware. They are the simulation, the agents, live 3D visualisation, analytics, and the evaluation harness that produced every figure above.
Achimota/Neoplan junction and the 3-junction N6 Nsawam corridor, built on real geometry with mixed traffic, private cars, shared trotros, signal-respecting pedestrian crossings.
One agent per junction; three independent agents on the corridor with no explicit communication. Shipped checkpoints selected by worst-case performance.
A full Accra streetscape, vehicles, pedestrians, day/night cycle and weather, driven live from the simulation over WebSocket. Built for non-technical stakeholders, including city officials.
Live queue, wait and throughput telemetry per junction and per phase, so behaviour can be inspected rather than inferred from a summary number.
Scripted multi-seed, multi-scenario benchmarking with exploration disabled, the harness that produced all 40 runs, re-runnable end to end on a laptop.
12 · Transferability & scaling
A swap test dropped each junction's trained policy onto the other junctions with zero retraining. Every swap failed outright. Lane layouts differ, so the inputs fall outside the model's training distribution, and on a corridor the damage compounds, because one misbehaving junction backs up into its neighbours.
Swap test, trained policy → target junction
Zero retraining, greedy policy. Reported because it is informative, not because it flatters the system.
The consequence, stated plainly
The product is not a checkpoint. It is the pipeline that produces one.
Network calibration, reward and training design, and the evaluation harness are the durable assets. A new junction is a retraining job measured in hours on commodity hardware, warm-started from existing weights.
13 · Roadmap
Multi-seed benchmarking across 8 scenarios, the 3D visualiser, and a reproducible evaluation harness are all shipped and running.
Camera-based vehicle and queue detection, injected sensor noise and dropout, and an explicit measurement of how much performance degrades under it.
Pilot engagement with a metropolitan road authority, instrumenting one live junction in shadow mode, recommending phases without controlling them.
Supervised control of a pilot corridor with measured before/after outcomes, extended junction by junction as each one clears its own evaluation.
Shadow mode means the controller recommends phases and is measured against the live timer without ever driving the signal. Nothing touches public traffic until it has been graded that way first.
14 · Why Google Africa Applied AI Lab
Between this deck and a live Accra junction sit two hard problems and one open research question. All three are things the Lab is unusually well placed to unblock.
Inductive loop sensors are expensive to install and maintain. Robust vehicle and queue estimation from ordinary roadside cameras is the single change that makes this deployable at African cost structures, and it is the gap between a validated controller and a live junction.
Three coordinated agents train on a laptop. Tens of junctions across a district is a different problem, more agents, more interaction, far more scenario coverage. Serious training capacity moves that from years to months.
Multi-agent stability, sim-to-real transfer, and safe deployment of a learned policy onto public infrastructure are open questions. They are answered better with Google engineers than alone.
A measured before/after on a real Accra corridor generalises directly to Lagos, Nairobi and Kampala. The same fixed-timer infrastructure, the same congestion economics, the same absent capital budget for new sensor hardware.
15 · Contact
Founder, Valiborn Technologies · Accra, Ghana
valiborntech@gmail.comSimulation-validated · Pre-pilot · Results are simulation-derived, no field deployment